Accounts Payable Aging Report: Ultimate CFO Guide
13 MAY 2026 · Updated 2 NOV · 18 min read
There is a particular kind of financial chaos that creeps up quietly on businesses that are growing fast. Revenue is up, orders are coming in, the sales team is celebrating. But somewhere in the back office, a pile of unpaid supplier invoices is getting older by the day. A vendor who has not been paid in sixty days sends a polite reminder. Then a firmer one. Then the shipments stop.
This is not a hypothetical. It happens to businesses of every size, across every industry, and it almost always has the same root cause: the finance team did not have a clear, current picture of what was owed and when. They were managing accounts payable reactively, responding to supplier calls instead of getting ahead of payment obligations.
The accounts payable aging report exists precisely to prevent this. It is one of the most fundamental documents in the finance function, a structured, time-based view of every outstanding supplier invoice that tells the AP team not just what is owed, but how long it has been owed and where the pressure is building. Used well, it is a powerful tool for cash flow management, supplier relationship health, fraud detection, and financial planning. Used poorly, or not used at all, it is a missed opportunity that shows up eventually as late payment penalties, strained vendor relationships, and cash flow surprises that could have been avoided.
This guide covers everything a finance team needs to know about the AP aging report: what it is, what it contains, how to read it intelligently, how to prepare one, how it compares to the AR aging report, what the data is really telling you beneath the surface, the best practices that separate high-performing AP teams from the rest, and the mistakes that undermine the report’s value even when it is being produced regularly.
What Is an AP Aging Report?
An accounts payable aging report is a financial document that summarizes all of a business’s outstanding supplier invoices, organized by vendor and categorized by how long each invoice has been outstanding. It gives the AP team a structured, time-based snapshot of the company’s payment obligations at any given moment.
The word “aging” refers to the age of each unpaid invoice, measured from either the invoice date or the invoice due date. Invoices are grouped into time-based categories, commonly referred to as aging buckets, that indicate how current or how overdue each outstanding balance is. This structure allows the AP team to see at a glance which invoices are on track, which are approaching their due date, and which are already past due and require immediate attention.
The AP aging report is one of the most commonly generated reports in any finance function, and for good reason. It serves as the operational heartbeat of the accounts payable process. Without it, managing payment obligations across dozens or hundreds of suppliers becomes a reactive, error-prone exercise that inevitably leads to missed payments, duplicate payments, and the kind of vendor friction that disrupts supply chains and damages commercial relationships.
Most accounting software and ERP systems can generate an AP aging report automatically, either on demand or on a scheduled basis. The report can be produced in two formats: a summary version that shows total outstanding balances by vendor, and a detailed version that shows individual invoice line items with invoice numbers, dates, due dates, and amounts. Both have their uses, and high-performing AP teams typically use both in combination.
What Does It Include?
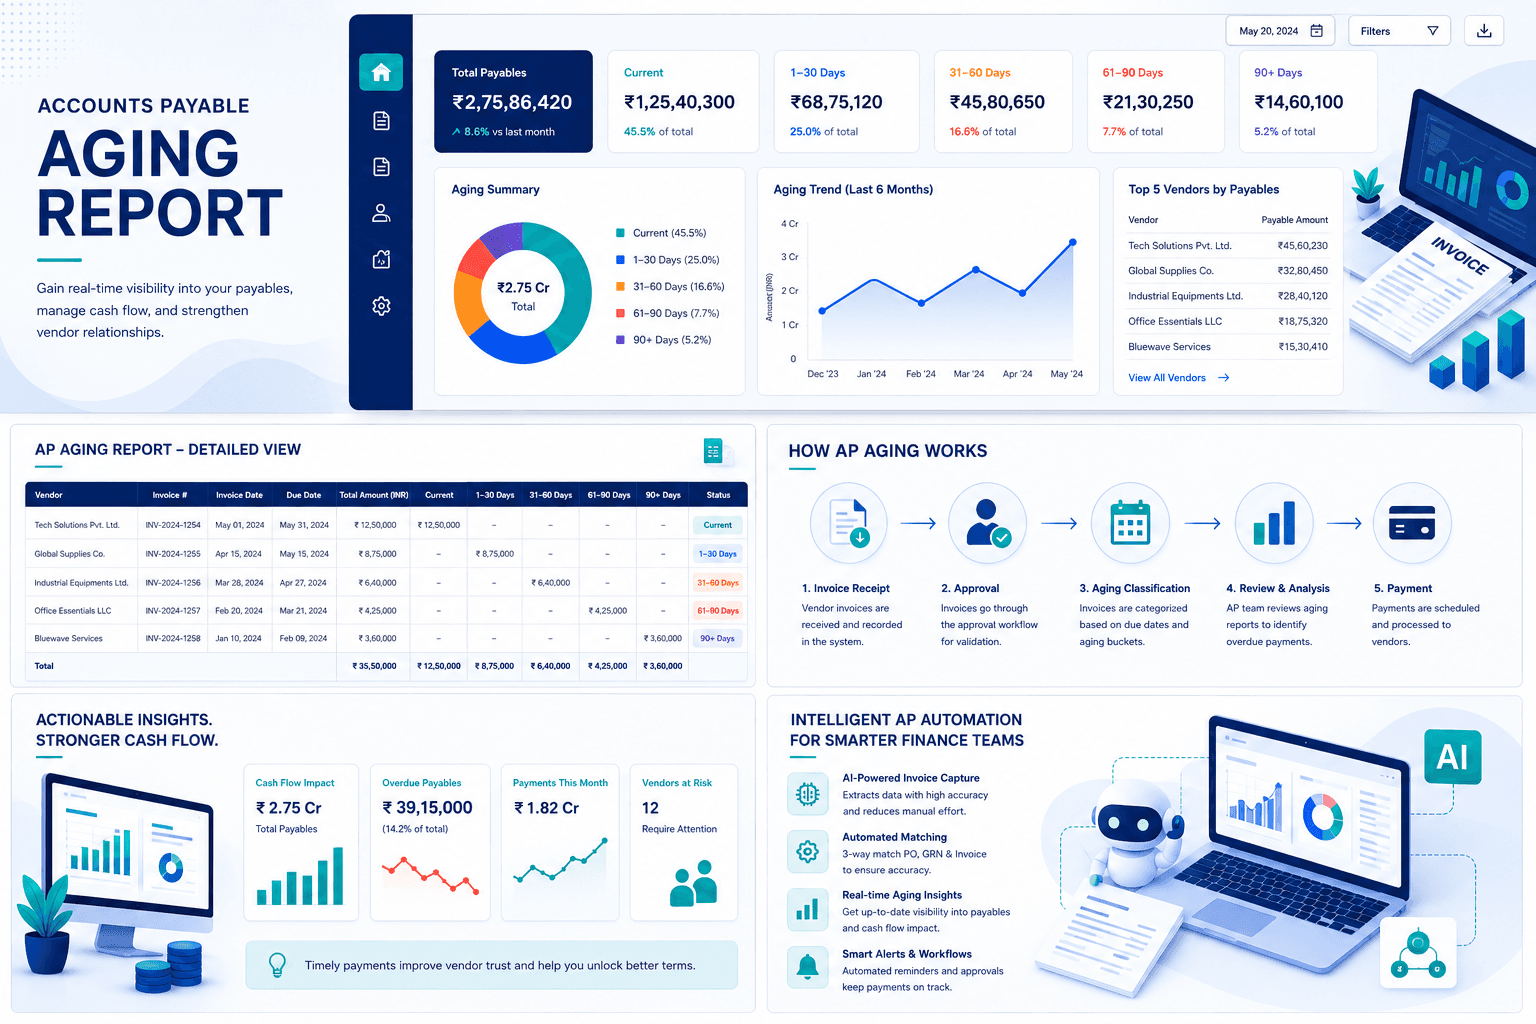
Understanding what an AP aging report contains is the foundation for being able to read and use it effectively. While the exact layout varies by accounting system, a well-structured AP aging report consistently includes the following elements.
Vendor Names
The report is organized by vendor, with each supplier listed in the first column. Every outstanding invoice, credit memo, and debit memo associated with that vendor appears beneath their name as a line item. This vendor-centric structure makes it easy to assess the total exposure to any individual supplier and to identify patterns in payment behavior with specific vendors.
Invoice Details
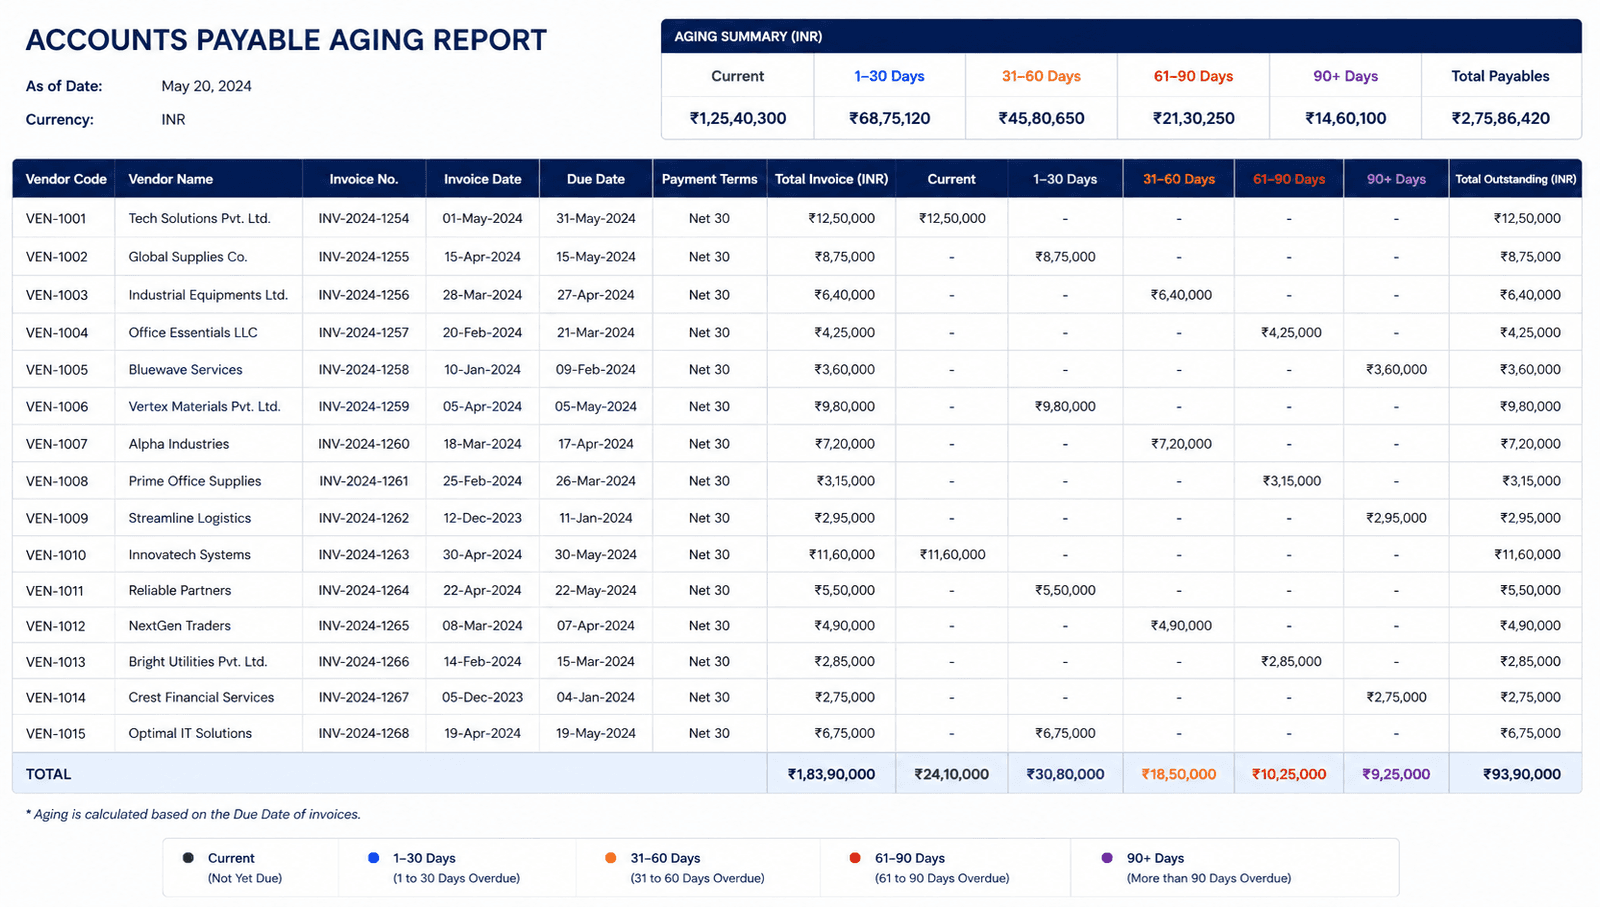
For each vendor, the detailed AP aging report lists individual invoices with their identifying information: invoice number, purchase order reference, invoice date, due date, payment terms, and the outstanding balance due. This level of detail is essential for resolving disputes, reconciling vendor statements, and maintaining a complete audit trail.
Aging Buckets
The aging buckets are the defining structural feature of the report. They categorize outstanding invoice balances by how long they have been outstanding, typically in thirty-day intervals. The standard bucket structure is:
Current (invoices not yet due), 1 to 30 days past due, 31 to 60 days past due, 61 to 90 days past due, and over 90 days past due.
Some organizations use more granular bucketing, adding 91 to 120 days and over 120 days categories for businesses with longer payment cycles or high volumes of aged payables. Each invoice amount is entered into the column that corresponds to its current aging status, giving an immediate visual indication of where the payment pressure is concentrated.
Credit Memos and Debit Memos
Credit memos, issued by suppliers to reduce the amount owed for returned goods, pricing corrections, or quality disputes, appear as negative line items within the relevant vendor’s section. Debit memos, which increase the amount owed, appear as positive amounts. Including these in the report is essential for accuracy: a report that shows only invoices without reflecting credits will overstate the true liability and can lead to overpayment.
Vendor Subtotals and Grand Total
Each vendor’s section is subtotaled across all aging buckets, showing the total outstanding balance for that supplier. At the bottom of the report, all vendor subtotals are aggregated into a grand total that represents the business’s total accounts payable liability. This grand total should reconcile to the accounts payable balance in the general ledger. If it does not, there are data integrity issues that need to be investigated and resolved before the report can be relied upon.
How to Read the Aging Buckets
Knowing what the aging buckets contain is one thing. Knowing how to interpret what they are telling you is another. Reading an AP aging report is not just about identifying which invoices are overdue. It is about understanding the overall pattern of the data and what that pattern signals about the health of the AP process and the business more broadly.
Start with the Current column. This shows invoices that have been received and recorded but are not yet due for payment. A healthy AP operation will have the majority of its outstanding balance here, typically seventy to eighty percent of the total. If the Current column is thin relative to the past-due columns, it is a signal that either the business is struggling to pay on time or that invoices are not being entered into the system promptly.
Move to the 1 to 30 days past-due column. Invoices in this bucket have missed their due date by up to a month. Some degree of balance here is normal in any active AP operation, particularly at month-end when payment runs have not yet cleared. But a large and growing balance in this bucket relative to previous periods is an early warning sign worth investigating.
The 31 to 60 days past-due column is where attention becomes more urgent. Invoices here are significantly overdue. Suppliers with balances in this range will typically have already followed up at least once. Leaving invoices in this bucket without action risks late payment penalties, relationship damage, and in some cases, disruption to ongoing supply.
The 61 to 90 days and over 90 days columns represent serious payment delays. Balances in these ranges typically indicate one of three things: a genuine cash flow problem that is preventing payment, a dispute with the supplier that has not been formally resolved, or an internal process failure where the invoice has been lost, misfiled, or stuck in an approval queue. Each of these requires a different response, but all of them require immediate attention.
One additional nuance worth understanding is the difference between invoice date aging and due date aging. Invoice date aging measures how long it has been since the invoice was issued. Due date aging measures how overdue the payment is relative to the agreed payment terms. Due date aging is generally more useful as an operational metric because it reflects actual payment risk: an invoice with net sixty payment terms that was issued forty-five days ago is not yet overdue, even though it is forty-five days old. Using invoice date aging in this situation would misclassify it as a problem when it is not.
How to Prepare One
Preparing an AP aging report manually involves a series of steps that, while straightforward in principle, become increasingly time-consuming and error-prone as invoice volumes grow. Understanding the process is valuable even for teams that rely on accounting software to generate the report automatically, because it helps diagnose data quality issues when the automated output does not look right.
The first step is to gather all outstanding invoices, credit memos, and debit memos from every vendor with an open balance. Completeness is non-negotiable here. A report that is missing even a handful of invoices understates the true liability and gives a misleading picture of the AP position.
The second step is to organize the invoices by vendor. Within each vendor grouping, individual invoices are listed with their identifying details: invoice number, date, due date, payment terms, and amount due.
The third step is to apply any payments that have been made since the invoices were recorded. Full payments remove the invoice from the report entirely. Partial payments reduce the outstanding balance. Early payment discounts, if taken, are applied at this stage as well.
The fourth step is to categorize each remaining outstanding balance into the appropriate aging bucket based on how many days past due the invoice is as of the report date. The aging calculation is straightforward: report date minus invoice due date equals number of days past due. The result determines which bucket the invoice falls into.
The fifth step is to enter credit memos and debit memos as separate line items within the relevant vendor section, with credits shown as negative amounts and debits as positive amounts.
The sixth step is to total each aging bucket column for each vendor, then calculate the grand totals across all vendors. These column totals represent the total outstanding liability by aging category.
The final and most important step is reconciliation. The grand total of the AP aging report must match the accounts payable balance in the general ledger. If it does not, the discrepancy needs to be identified and resolved before the report is used for any decision-making purpose. Common causes of reconciliation differences include invoices recorded in the GL but missing from the aging, payments recorded in the GL but not yet applied in the AP subledger, and timing differences around month-end cutoff.
AP Aging vs AR Aging
The AP aging report has a direct counterpart on the revenue side of the business: the accounts receivable aging report. Understanding the relationship between the two is important for any finance team that is trying to manage working capital intelligently.
The AP aging report shows what the business owes its suppliers. It is a liability view, reflecting the company’s position as a customer in its supplier relationships. The AR aging report shows what customers owe the business. It is an asset view, reflecting the company’s position as a supplier in its customer relationships.
Both reports use the same structural framework, organizing outstanding balances by counterparty and grouping them into aging buckets by days outstanding. But the operational implications of each are different. The AP aging report drives payment prioritization and cash outflow planning. The AR aging report drives collections activity and cash inflow forecasting.
The real value of looking at both reports together lies in working capital management. A business that is collecting from its customers in an average of thirty days but paying its suppliers in an average of sixty days is in a relatively strong cash position. The gap between when cash comes in and when it goes out creates a natural working capital buffer. A business in the reverse situation, paying suppliers faster than it collects from customers, is effectively financing its customers at its own expense, and that gap needs to be funded somehow, whether through cash reserves, a credit line, or renegotiated terms on one or both sides.
Days Payable Outstanding (DPO) is the key metric derived from the AP aging report. It measures the average number of days the business takes to pay its supplier invoices and is calculated by dividing the total accounts payable balance by the daily cost of goods sold. A higher DPO means the business is holding onto cash longer before paying suppliers. A lower DPO means it is paying faster. Neither is inherently good or bad. The right DPO depends on the business’s cash position, its supplier relationships, and whether early payment discounts make faster payment economically attractive.
What Your AP Aging Report Is Actually Telling You
Most finance teams use the AP aging report as an operational tool: identify what is overdue, prioritize payments, repeat. That is valuable, but it understates what the report can tell you if you look at the data more strategically.
Cash Flow Pressure
A sudden increase in the proportion of balances sitting in the 61 to 90 or over 90 days buckets is one of the earliest and most reliable indicators of a cash flow problem. When a business cannot pay its suppliers on time, it shows up in the aging report before it shows up anywhere else in the financial statements. Finance leaders who review the AP aging report regularly and track trends over time will spot cash flow deterioration earlier than those who only look at the balance sheet quarterly.
Supplier Dispute Signals
Invoices that have been sitting in the past-due buckets for an extended period without payment are often not simply forgotten. They frequently represent disputes, whether over price, quantity, quality, or delivery terms, that have not been formally resolved. When the same vendor consistently has balances in the 60-plus day bucket, that is a signal to investigate whether there is an unresolved commercial issue with that supplier rather than simply treating it as a collections problem.
Internal Process Failures
An invoice that is ninety days past due in a business that is otherwise financially healthy is usually an internal process problem. It may have been received and never entered into the system. It may have been entered but routed to an approver who never actioned it. It may have been approved but excluded from payment runs due to a data entry error. The aging report surfaces these situations, but diagnosing the root cause requires looking behind the report at the invoice’s journey through the AP process.
Fraud Risk Indicators
The AP aging report can also surface potential fraud signals when reviewed with the right lens. Unusually large invoices from unfamiliar vendors appearing in the current bucket deserve scrutiny. Vendors with duplicate entries at slightly different name spellings or invoice numbers warrant investigation. Negative balances that have persisted for multiple periods without being resolved through refund or credit application may indicate fictitious credit memos. None of these patterns are definitive proof of fraud, but they are the kind of anomalies that a well-designed internal control environment should be investigating regularly.
Vendor Concentration Risk
Looking at the distribution of AP balances across vendors reveals concentration risks that might not be apparent from other reports. If a significant proportion of the total outstanding balance is owed to a single supplier, that supplier has considerable leverage over the business’s operations. A disruption in that relationship, whether due to late payment, a commercial dispute, or external factors, could have an outsized impact on the supply chain. The aging report makes this concentration visible so it can be managed proactively.
Best Practices for Using It Effectively
Producing an AP aging report is straightforward. Using it effectively requires discipline, consistency, and a clear process for acting on what the data shows.
Review Frequency
The AP aging report should be reviewed at minimum once a month, aligned to the payment run cycle. For businesses with high invoice volumes, a large supplier base, or tight cash flow, weekly reviews are significantly more valuable. The report reflects a snapshot of AP health at a point in time, and the more frequently that snapshot is taken, the earlier problems can be identified and addressed.
Reconcile Every Time
Every time the AP aging report is produced, it should be reconciled to the general ledger before it is used for any decision-making purpose. An unreconciled aging report is an unreliable one. Building reconciliation into the standard report production process, rather than treating it as an optional step, ensures that data quality issues are caught and resolved before they compound.
Pay Attention to Trends, Not Just Snapshots
A single AP aging report tells you the current state of payables. A series of reports over time tells you whether the situation is improving or deteriorating. Tracking the proportion of balances in each aging bucket from period to period, and monitoring DPO as a summary metric, gives finance leaders a much richer picture of AP health than any individual report can provide.
Prioritize Strategically, Not Just by Age
The instinct in AP is to prioritize payment of the oldest invoices first. But that is not always the right approach. A more strategic approach considers early payment discount windows, the commercial importance of specific supplier relationships, the risk of supply disruption from specific vendors, and the business’s current cash position. The aging report provides the data for this strategic prioritization. The AP team provides the judgment.
Investigate, Do Not Just Clear
When an invoice appears in the 60-plus day or 90-plus day bucket, the first instinct is often to pay it quickly to clear the aging. But paying a past-due invoice without understanding why it got there perpetuates the underlying problem. Taking the time to understand whether the delay was caused by a data entry error, an approval bottleneck, a dispute, or a cash flow constraint allows the root cause to be addressed and the same situation to be avoided in the future.
Common Mistakes Teams Make
Even finance teams that produce AP aging reports regularly make mistakes in how they use them. These are the most common ones.
Running It Too Infrequently
Producing an AP aging report once a month and filing it away is not the same as using it as a management tool. A report that is reviewed only at month-end has already missed the window to prevent invoices from becoming significantly past due during the month. More frequent production and review dramatically increases the report’s operational value.
Ignoring Credit Memos
Credit memos that are not properly reflected in the aging report cause the report to overstate the true AP liability. Over time, unrecorded or misapplied credits create reconciliation differences, distort cash flow planning, and can lead to overpayments if the AP team pays invoices without netting off available credits. Ensuring that every credit memo is recorded promptly and matched to the appropriate invoice or vendor balance is a basic but frequently neglected discipline.
Treating It as a Compliance Checkbox
Some finance teams produce the AP aging report because the external auditor or the CFO asks for it at period end, not because they are actively using it to manage the AP function. A report produced purely for compliance purposes, without anyone meaningfully reviewing and acting on the data, provides none of the operational or strategic value the report is capable of delivering. The aging report is most valuable as a live management tool, not a periodic filing requirement.
Not Reconciling to the General Ledger
Using an aging report that has not been reconciled to the GL is like navigating with a map that might be wrong. The data looks plausible but cannot be trusted. Reconciliation differences, even small ones, can compound over time into significant reporting inaccuracies. Building mandatory reconciliation into the report production process eliminates this risk.
Confusing Invoice Date and Due Date Aging
Using invoice date aging instead of due date aging leads to misclassification of invoices that have long payment terms. An invoice issued ninety days ago with net ninety payment terms is not overdue. Treating it as a ninety-day past-due item distorts the aging picture and creates unnecessary urgency around invoices that are actually current. Understanding which aging basis the accounting system uses and ensuring it is consistent across reporting periods is an important but easy-to-overlook configuration detail.
Conclusion
The accounts payable aging report is deceptively simple. It is a list of invoices, organized by vendor and grouped by age. But within that structure sits some of the most actionable financial intelligence available to a finance team. It tells you what you owe and when. It tells you where your payment process is breaking down. It surfaces supplier disputes, cash flow pressure, fraud signals, and concentration risks before they become crises. And it gives you the data you need to manage payment prioritization strategically rather than reactively.
The difference between a finance team that produces the AP aging report and a finance team that uses it is significant. The first team has a document. The second team has a management tool. Getting the most out of the AP aging report requires consistent production, disciplined reconciliation, regular trend analysis, and a clear process for investigating and acting on what the data reveals.
For any business that is serious about cash flow management, supplier relationship health, and financial control, the AP aging report is not optional. It is foundational. The question is not whether to produce it, but whether the team is getting everything it can out of it.